A Short Survey of PProf Visualization Tools
March 17, 2017
Debugging CPU related issues can often lead to nuanced questions about trends. Does the heap usage spike or grow gradually? Where is this routine being called from and how often?

A picture is worth a thousand words
A picture provides useful context in a way that can otherwise be painful to interpret. By backing graph visualizations with pprof data useful CPU statistics can be contextualized over time.
What is PProf?
PProf is a cpu profiler that is part of the gperftools developed by Google for analyzing multi-threaded applications. The pprof package of golang’s standard library provides the data needed by the pprof tool via HTTP.
Since pprof data is served via HTTP, it is essential to run a webserver in your application. As a side-effect of simply importing pprof, the package will register its handlers with the running webserver so no further action is needed.
For a long-running application, this is an example of using pprof:
import (
	"log"
	"net/http"
	_ "net/http/pprof"
)

func main(){
	go func() {
		log.Println(http.ListenAndServe("localhost:6060", nil))
	}()
...
(taken from http://golang.org/pkg/net/http/pprof/)
Using pprof
 http://blog.golang.org/profiling-go-programs
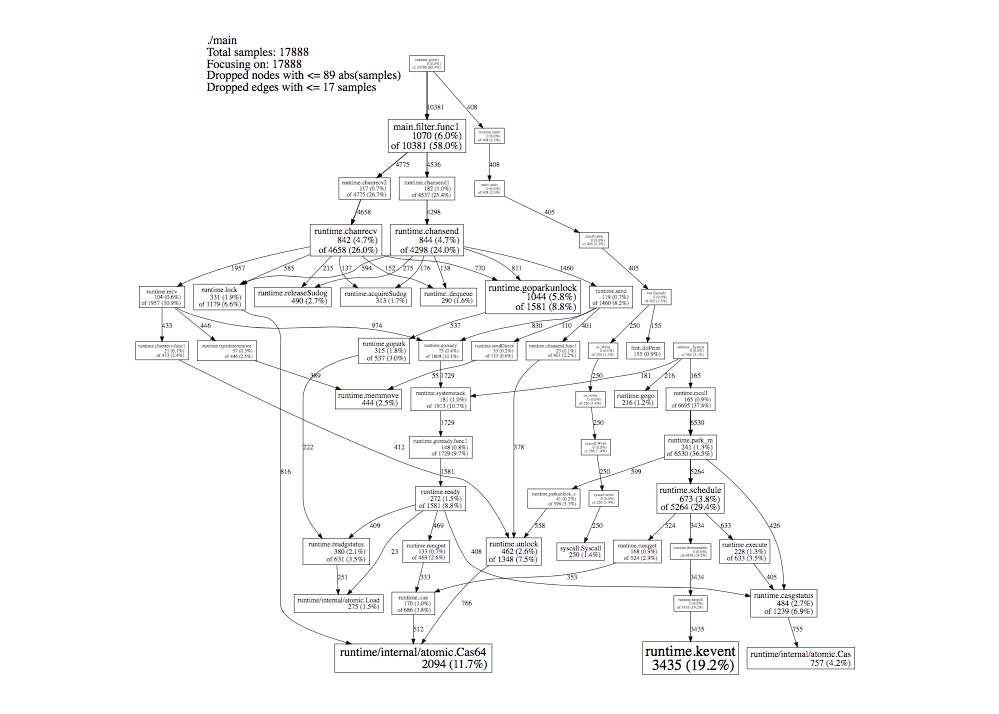
PProf comes with the ability to generate graphviz visualiztions of a program’s call graph. PProf bases the graph off of a 30 second sample from a running go application.
- Edges represent function calls and are labeled with number of samples with the given function call.
- Size of box corresponds to number of samples with function running.
- Each box has 2 labels: the percentage of time that the function was running and the percentage of time that it showed up as part of a stack trace.
Installation on Mac
$ brew install gperftools $ brew install graphviz $ pprof –web localhost:6060/debug
Go-Torch
 http://github.com/uber/go-torch http://www.brendangregg.com/flamegraphs.html
Go-torch is a tool created by Uber to use Brendan Gregg’s scripts to generate flame graphs for go programs. Like PProf, the visualization is based off a 30 second sample from running the application.
- Stack frames are stacked on top of each other vertically, showing the stack depth.
- Frame width represent the percentage of time that a function showed up as part of a stack trace.
- If a function has several ancestors, it will show up several times. (On top of each distinct ancestor’s stack.)
- Colors are arbitrary and x-position is in alphabetical order.
Installation
requires the installation of go-torch tool, and flame graph scripts by brandangregg.
$ go get github.com/uber/go-torch
$ git clone git@github.com:brendangregg/FlameGraph.git
$ export PATH-$PATH:/path/to/FlameGraph
go-torch --file "torch.svg" --url http://localhost:6060
GOM
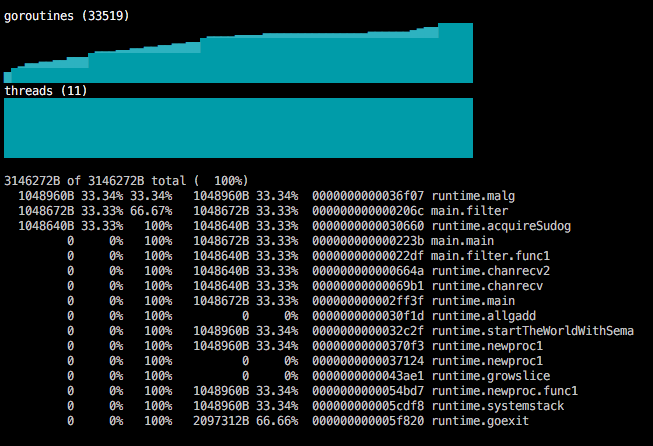
GOM is a real time curses-style command line tool with visualization of a running go application, written by Google developer Jaana Dogan.
- has visualization of running goroutines and machine threads over time.
- Updated in real time.
- In addition to visualization, GOM also provides text-based profiles of CPU and heap.
$ go get github.com/rakyll/gom/cmd/gom
as a side-effect of importing gom, gom will register extra handlers as well as the pprof ones.
import (
	_ "github.com/rakyll/gom/http"
)
$ gom --target http://localhost:6060
Debug charts
 http://github.com/mkevac/debugcharts
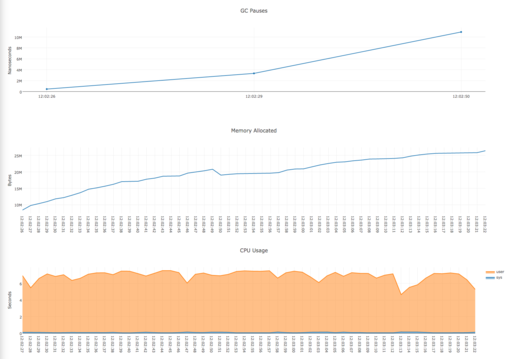
Debug charts is a tool by Marko Kevac that uses the plotly.js library to create a running web view of a running go application.
- Runs in browser.
- Has visualization of gc pauses, memory allocated and cpu usage.
- Updated in real time.
$ go get github.com/mkevac/debugcharts
as a side-effect of importing debugcharts, debugcharts will register extra handlers as well as the pprof ones.
Then direct your browser to localhost:6060/debug/charts}